Versus

Versus Charts
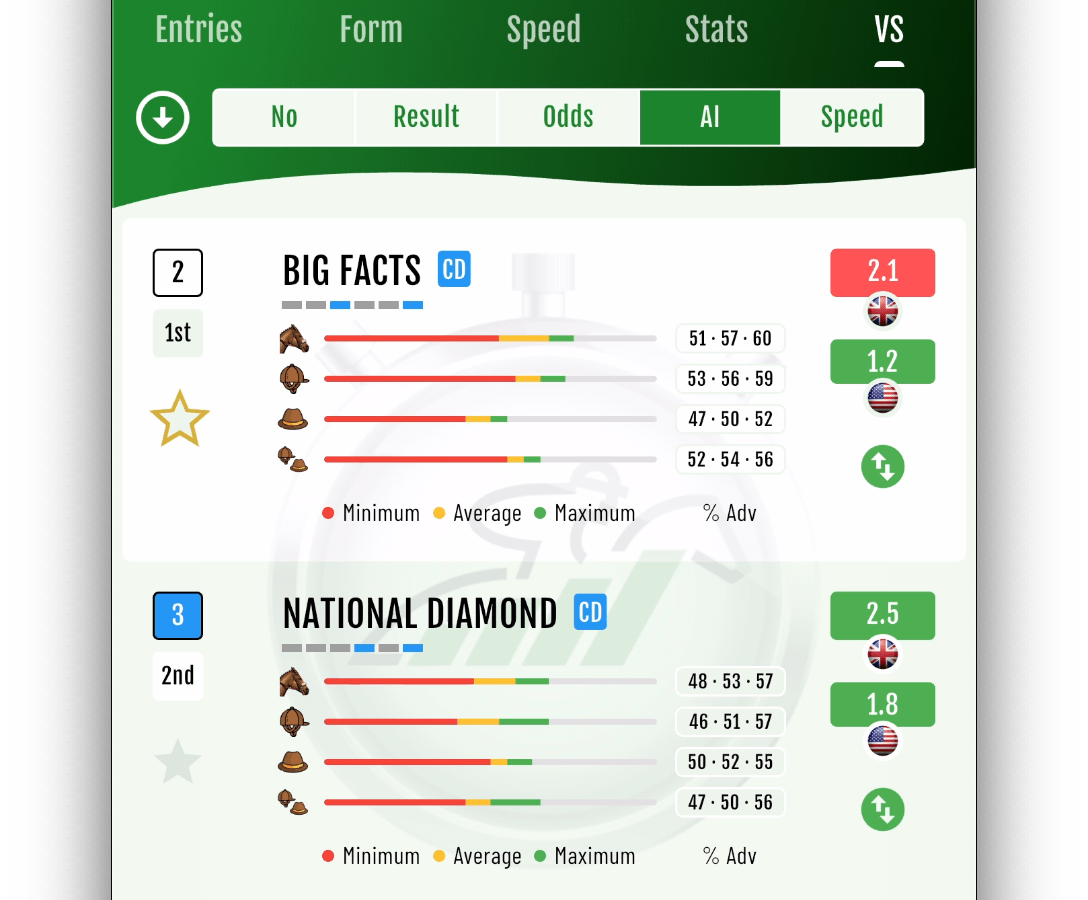
The Versus Charts compare each horse, jockey, trainer, and jockey/trainer pairing against all other competitors in a race.
These charts display the minimum, average, and maximum probability of each entry beating the others in simulated head-to-head races.
This provides an excellent way to assess the competitiveness of the race and determine whether any single entry has a clear advantage over the others.
For example, if a horse had probabilities of 51-57-60 it means the minimum AI rating it achieved against other horses was 51%, the average was 57% and the maximum was 60%, making it a good pick. No other horse had a better chance of winning in the simulated head-to-head races.